
Inflation, inflation, inflation. If you have been reading the financial news, or even just the regular news, you will have heard a lot about the rise in the cost of goods and services this year. From the US to Europe, politicians have been desperately trying to shift the blame for the crisis away from their own central bank’s unprecedented money printing to the President of Russia. Whether they get away with such misdirection is yet to be seen, but President Putin himself is having none of it, as you can tell from this excerpt from one of his speeches.
Putin, while clearly not deserving of support, is absolutely right that Europe and the US have created this mess for themselves, and there is no doubt that he is now exploiting this weakness by regulating the flow of gas into Europe, making for a very uncomfortable winter ahead for Germany in particular, and the rest of Europe and the UK also. I didn’t realise until I read this BBC article that “A younger Vladimir Putin did his PhD thesis on the importance of Russian energy exports.” The Germans should have seen this coming a long way out. Having pumped up the money supply, and also made themselves dependent on cheap Russian energy, the EU and UK leadership have some gall to refer to the current situation as a “cost of living” crisis…
However, the goal of this post is not to discuss geopolitics. As a resident of Japan, I am interested in knowing if the inflation monster is lurking in Tokyo Bay, ready to go Godzilla on the Japanese consumer? As fellow Japan residents are well aware, Japan has not seen inflation in decades, and, as noted in Japan Mortgages – Fixed or Floating?, Bank of Japan boss Kuroda-san threw everything but the kitchen sink at the problem in order to reach the magic 2% mark. Now, with inflation at 2.5%, the yen at 25-year lows against the dollar, and the rest of the world facing a food and energy crisis, you can’t help wondering if prices aren’t going much much higher.
Of course, when it comes to the big questions of economics, the only correct answer is that no one knows. Financial journalists and macro gurus generally have a bleak outlook for Japan. With the US Federal Reserve still intent on raising rates to fight inflation there, the yen looks anything but safe at the 140 level, and a weaker yen could mean higher imported inflation. Another spike in energy prices due to the Russia / Ukraine situation and things could get expensive quickly.
Interestingly though, there is an optimist in our midst. Jesper Koll, according to his profile, is an economist, strategist, angel investor, patron, producer, and yes, a Japan optimist. A resident of Japan since 1986, and with experience at two major US investment banks, he has a new substack titled, of course, Japan Optimist. And it was there I found his July post titled: Who’s afraid of inflation? Not Japan
I encourage you to read the post yourself, but here’s a short summary:
There are two reasons that Japan is less impacted by inflation than other developed countries, for example, the United States:
- The government here is not afraid to intervene in markets to preserve the purchasing power of the people. About one-quarter of goods and services are subject to government regulation, which effectively means price controls. This goes for health care, education, transport, and staple foods. This year surging gasoline prices have been kept under control by government intervention
- At the same time, Japan’s domestic industrial structure is much more cut-throat competitive. In the US, the big players control twice as large a share of the manufacturing and service industries. Japan is more fragmented and competitive, and that competition keeps prices low.
Jesper notes that the Japanese government not only considers it important to protect citizens from economic shocks, but it also has the necessary parliamentary majority to act far more quickly than the US government is able to. So unlike in the US, where the Federal Reserve is having to fight inflation on its own, the Bank of Japan gets plenty of backing from the government.
Japan’s government and economic system comes in for so much bashing in the media that it’s almost shocking to hear from someone as positive as Jesper. And once more I’ll remind you that no one really knows how the global inflation issue will play out, here or abroad. However, the lack of polarization over every issue certainly puts Japan in a better position to take action than much of the western world.
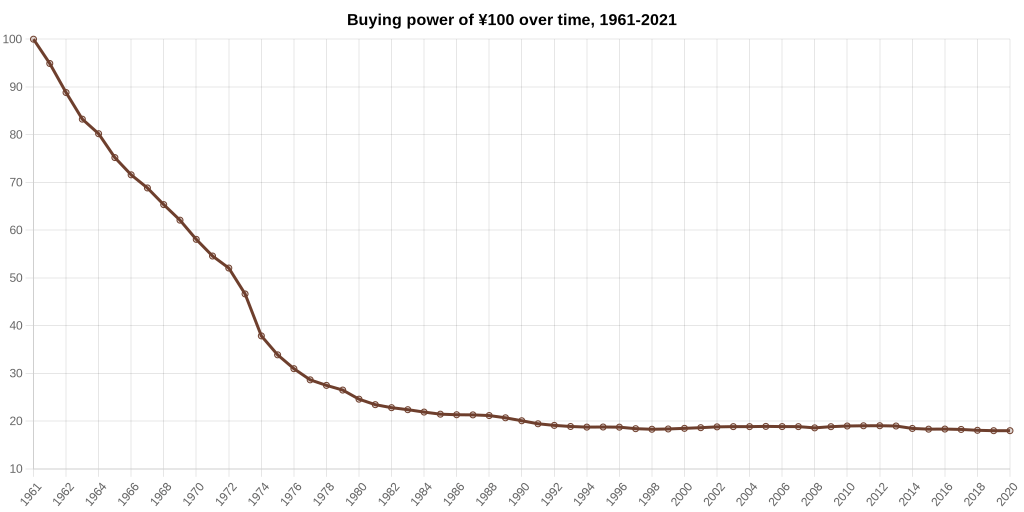
From a financial planning perspective, inflation is something you should always be concerned about. I would argue that the whole point of investing is to at least keep pace with, and preferably outperform, the rise in the cost of goods and services over time. To put it another way, it’s all about preserving and increasing spending power. Remember, it’s not the cost of things that is going up, it’s the value of money that is going down. At the risk of sounding like a broken record, beating inflation in your base currency is the name of the game. Whether inflation in Japan gets worse or not, if you are going to spend the money in Australia, saving and investing in JPY does not really help you.
If you are planning to stay in Japan long term and JPY is your base currency, here are a few things you can do to protect yourself against inflation:
- Keep an emergency cash reserve – make sure you have a buffer in case prices increase more than expected.
- Invest – anything surplus to your cash reserve can be invested for the medium to long term, whether it’s NISA, iDeCo, a brokerage account, ETFs, dividend stocks, REITS, gold. You are not going to preserve your spending power sitting in JPY cash.
- Expect volatility – you need to be mentally prepared that your investments are unlikely to just go up in a straight line in this environment. Remember you are trying to beat inflation over time, not in the next 6 months.
Finally, if you enjoyed a bit of optimism for a change I recommend checking out Human Progress. Their Twitter account is here. With all the doom-scrolling it’s sometimes nice to be reminded how much progress we have made as a species!
Disclaimer: This should go without saying, but the information contained in this blog is not investment advice, or an incentive to invest, and should not be considered as such. This is for information only.